Gender Pay Gap – US

See the data: bit.ly/KIB_PayGapUS
Play a data game! Spot the jobs where women are actually paid more than men.
Analysis
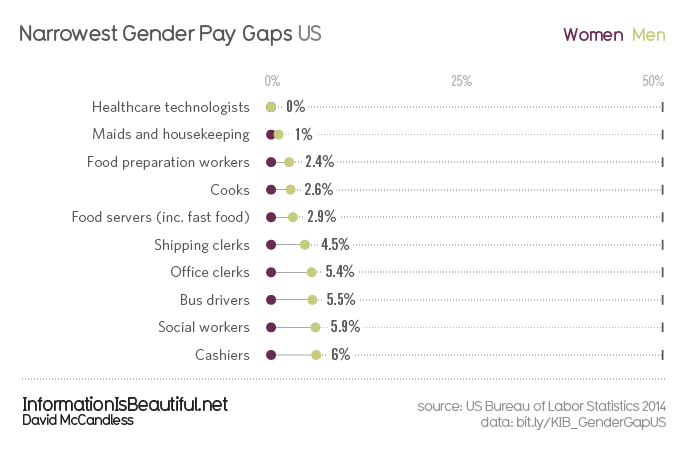
A pretty depressing picture of the gender pay gap in the United States, non?. The gap is uniformly present across every industry and sector. On average, men earn 17% more than women.
One caveat around this data from the US Bureau of Labour Statistics. It’s very patchy. Of 570 vocations, there was only complete male and female salary data for 148 jobs (25%). Not a bad sample but patterns and exceptions may be present in a fuller dataset. Please bear that in mind in your interpretation.
From that sample, here’s the breakdown:
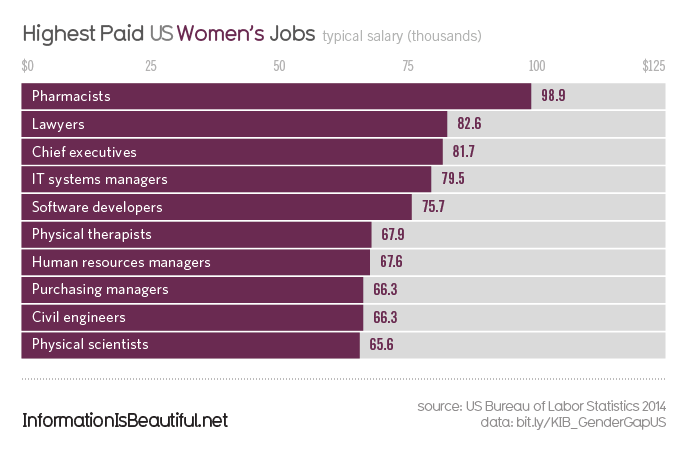
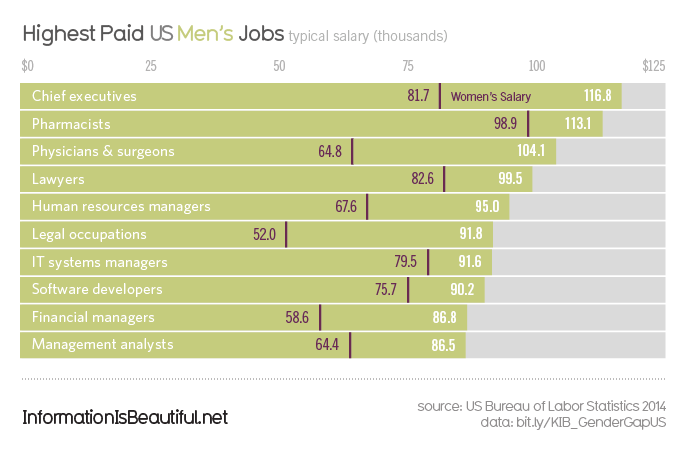
Law has the widest pay gap of all, with men typically earning 43.3% more than their female counterparts. The earnings gap between male and female CEOs is smaller than between laywers. But the amount a female lawyer can earn (typical salary $82.6k) is still higher than what a typical female CEO takes home ($81.7k)
Biggest Gender Pay Gap increases (2012 v 2014)
We took a snapshot of this data back in 2012 so we were able to do a two year comparison. Top 15:
Business operations 54% increase*
Police & patrol officers 27%
Computer support specialists 26.3%
Medical Scientists 23.5%
Operations research analysts 20.8%
Clergy 16.7%
Physicians & surgeons 16.7%
Human Resource managers 14%
Receptionists 13.5%
Recreation & fitness workers 13.1%
Bartenders 12.8%
Bookkeepers 10.9%
Diagnostic technicians 10.1%
IT Managers 10%
(*That ‘Business Operations’ 54% outlier seems way counter-intuitive compared to the rest of the data, so may be an anomaly.)
Share this:
» Check out our beautiful books
» Learn to be a dataviz ninja: Workshops are Beautiful
» Be the first to know: join our VIP Newsletter


