I’ve been playing with Google Insights. It’s a great toy. It measures ‘search intensity’. The number of searches being made for a certain term.
Off the back of the recent timeline of global media scare stories, I got curious about what searches actually look like.
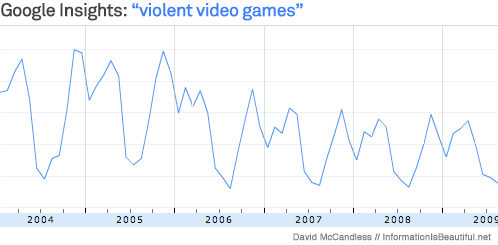
For example, the search “violent video games” reveals a very distinct pattern.
Why that distinct pattern? If you add the dates, it clarifies things:
Every April and November the issue flares up. Why?
April 20th is the anniversary of the Columbine Massacre. Though dimishing, the echoes of that event still reverberate through the group mind.
Not sure about the November peak? Maybe because Christmas video games are announced?
Face Off
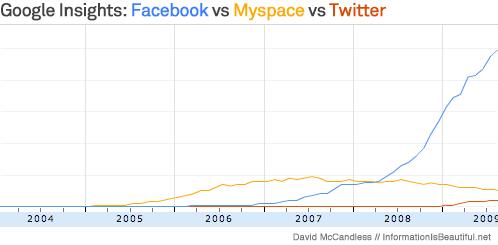
A cool thing about Insights. You can pile multiple search terms into the interface and force them into a face off. A bit like putting a fly and a spider and an earwig in a bottle. You’ve done that, right?
I like this one for putting the Twitter hype in perspective.
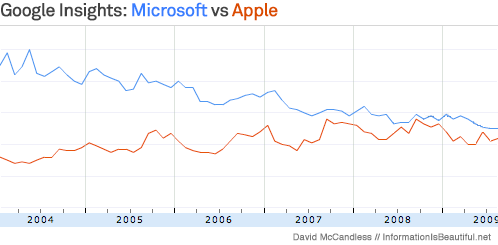
It’s also good for the settling of age old conflicts.
(Though, technically, the results for ‘apple’ might get some noise for people searching for the popular fruit online)
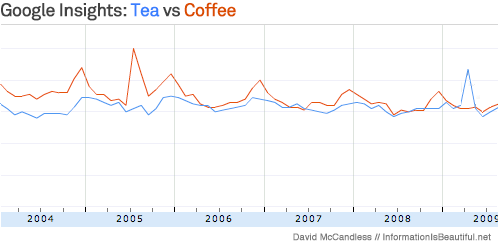
Why those big peaks?
Hahah. Brilliant. Those peaks occur at the height of summer in July. Though there was a considerable dip in 2007. Bad summer then? Maybe we could map these to global temperatures to make a more human (and tasty) barometer of weather fluctuations. Maybe future super-ironic generations will use searches for “ice cream” as climate records?
ANYWAY. Insights a great fun tool for scoping patterns in data or to rate preferencess – or even to help with personal decisions.
Have a play. Let me know any cool stuff you come up with.


